How Risky is Risk?
'Risk' is an appropriately named board game which revolves around battling opposing armies with the aim of invading their territories and eventually conquering the world. The game involves a large amount of strategy and planning but also some luck; battles are ultimately won and lost by the rolls of dice. This post is going to explore the battle mechanic in more detail, starting by calculating the probability of winning in different scenarios and then showing how we can get a deeper insight into these numbers with some data visualisation.
Battles in Risk
The complete rules of Risk won't be described here (see here if interested) but it is worth describing how battles work in particular. The attacking side can take up to 3 troops into the battle and the defender can take up to 2 troops. Each player then rolls one dice for each of the troops and arranges their dice in descending order. Each players dice are then compared from highest to lowest, with any extra dice from one player being ignored. For each comparison, the player with the lowest dice roll loses a troop. If it is a draw the defender wins, so the attacker loses a troop.
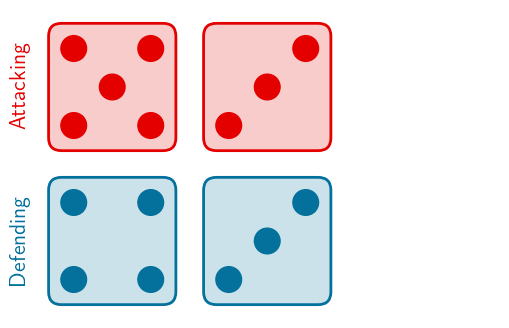
For example, if the attacker takes 3 troops and the defender takes 2, each player would roll that number of dice:

After rolling, they sort into ascending order, and the attacker would discard their smallest dice as they have one extra one:
Then the dice are compared in order, meaning in this case the attacker wins on the first dice and the defender wins on the second (as defense wins draws):
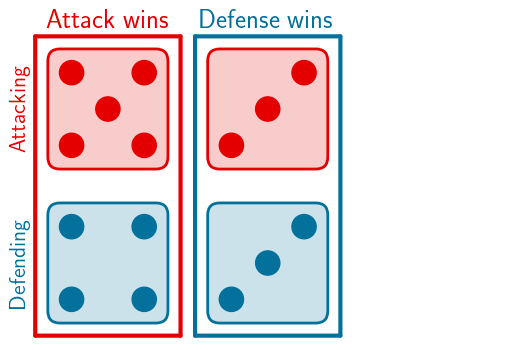
So in this case, both players will lose one troop.
There is certainly luck involved in the outcome, but each player does have some control in that they can choose how many troops they take into the battle. Intuitively, sending in more troops gives you more dice to roll and a better chance of winning, but it isn't immediately clear how much of an advantage each extra troop brings and whether that advantage is enough to risk losing that troop for the rest of the game.
In some versions of Risk, there is an additional battle mechanic where, depending on other game factors, either the attacker or defender can get an additional advantage in the form of adding a value to their highest dice before the comparison happens. In some cases, the attacker can get a +1 score added to their highest dice or the defender can get either a +1 or +2 advantage. These additions further complicate the situation - for example, is taking in a single troop with a +2 advantage better than takinmg in 2 troops with no advantage? The next section explores these probabilities in more detail.
Battle Probabilities
There are \(6^n\) different ways of rolling \(n\) dice, if order is ignored. So if the attacker has n dice and the defender has m dice, there are \(6^{m+n}\) possibilities, each equally likely to happen. As \(m+n \le 5\), this is at most \(6^5=7776\) possibilities.
This is small enough to allow every possibility to be evaluated computationally to determine the outcome of the battle in each scenario. Then the expected number of troops lost by each side can be calculated by averaging over the possible rolls. Doing this for 1, 2, or 3 attacking troops, 1 or 2 defending troops as well as optionally either +1 or +2 defensive advantage or a +1 attacking advantage gives the following results for the 24 different battle scenarios:
| Attacking Troops | Defending Troops | Advantage | Expected Attacking Losses | Expected Defensive Losses | Expected Attacking Losses (Exact fraction) | Expected Defensive Losses (Exact fraction) |
|---|---|---|---|---|---|---|
| 1 | 1 | +2 Defense | 0.833333 | 0.166667 | 5/6 | 1/6 |
| 1 | 1 | +1 Defense | 0.722222 | 0.277778 | 13/18 | 5/18 |
| 1 | 1 | Even | 0.583333 | 0.416667 | 7/12 | 5/12 |
| 1 | 1 | +1 Attack | 0.416667 | 0.583333 | 5/12 | 7/12 |
| 1 | 2 | +2 Defense | 0.935185 | 0.064815 | 101/108 | 7/108 |
| 1 | 2 | +1 Defense | 0.861111 | 0.138889 | 31/36 | 5/36 |
| 1 | 2 | Even | 0.745370 | 0.254630 | 161/216 | 55/216 |
| 1 | 2 | +1 Attack | 0.578704 | 0.421296 | 125/216 | 91/216 |
| 2 | 1 | +2 Defense | 0.731481 | 0.268519 | 79/108 | 29/108 |
| 2 | 1 | +1 Defense | 0.583333 | 0.416667 | 7/12 | 5/12 |
| 2 | 1 | Even | 0.421296 | 0.578704 | 91/216 | 125/216 |
| 2 | 1 | +1 Attack | 0.254630 | 0.745370 | 55/216 | 161/216 |
| 2 | 2 | +2 Defense | 1.500772 | 0.499228 | 1945/1296 | 647/1296 |
| 2 | 2 | +1 Defense | 1.386574 | 0.613426 | 599/432 | 265/432 |
| 2 | 2 | Even | 1.220679 | 0.779321 | 791/648 | 505/648 |
| 2 | 2 | +1 Attack | 1.000000 | 1.000000 | 1 | 1 |
| 3 | 1 | +2 Defense | 0.666667 | 0.333333 | 2/3 | 1/3 |
| 3 | 1 | +1 Defense | 0.506173 | 0.493827 | 41/81 | 40/81 |
| 3 | 1 | Even | 0.340278 | 0.659722 | 49/144 | 95/144 |
| 3 | 1 | +1 Attack | 0.173611 | 0.826389 | 25/144 | 119/144 |
| 3 | 2 | +2 Defense | 1.251029 | 0.748971 | 304/243 | 182/243 |
| 3 | 2 | +1 Defense | 1.113169 | 0.886831 | 541/486 | 431/486 |
| 3 | 2 | Even | 0.920910 | 1.079090 | 2387/2592 | 2797/2592 |
| 3 | 2 | +1 Attack | 0.673225 | 1.326775 | 1745/2592 | 3439/2592 |
Notice that the combined number of lost troops will always be \(min(\)Attacking Troops, Defending Troops\()\).
An interesting scenario happens when both players take two troops to battle, and the attack has a +1 advantage to the higher dice. In this case the battle is perfectly balanced with both players expected to lose one of their two troops. This makes sense, with the +1 advantage for the attacker on the first dice reversing the natural bias towards the defender in the case of a draw, although that defensive bias still exists on the second dice, resulting overall in an expected draw.
To highlight the example from above, it turns out that having a +2 defensive advantage but only a single troop is better than having 2 troops without an advantage. Again, this makes sense after thinking about each case. For a single troop with a +2 advantage, the expected highest dice will be 5.5 (3.5 for a usual dice, then +2). For two dice with no advantage, the expected highest dice is \(6*\frac{11}{36} + 5*\frac{9}{36} + 4*\frac{7}{36} + 3*\frac{5}{36} + 2*\frac{3}{36} + 1*\frac{1}{36}=4.47...\)
These results are interesting, but it is still quite hard to consume this data in a raw state. The next section will explore how to better visualise this dataset.
Visualising the Results
This raw dataset is 5 dimensional: 1. Number of attacking troops 2. Number of defending troops 3. Advantage 4. Expected Attacking Losses 5. Expected Defensive Losses
It would be difficult to display all of these dimensional in a traditional bar chart or line plot, and some of these dimensions would need to be dropped. Luckily though, some of these dimensions are discrete instead of continuous so can be visualised in a more creative way.
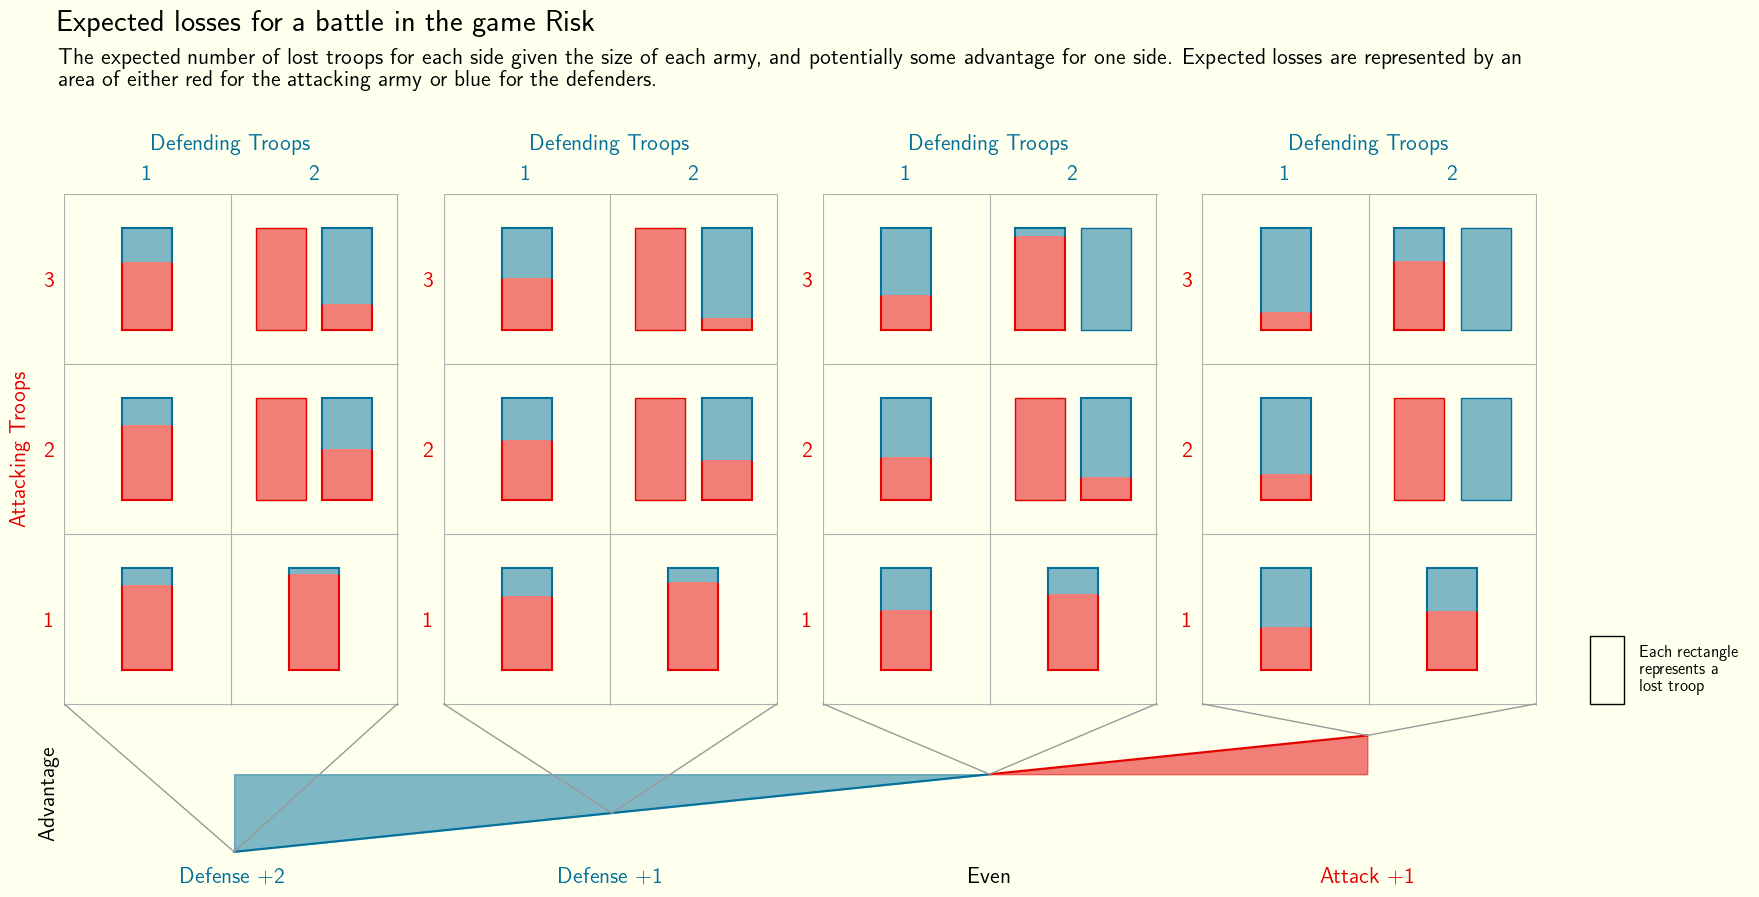
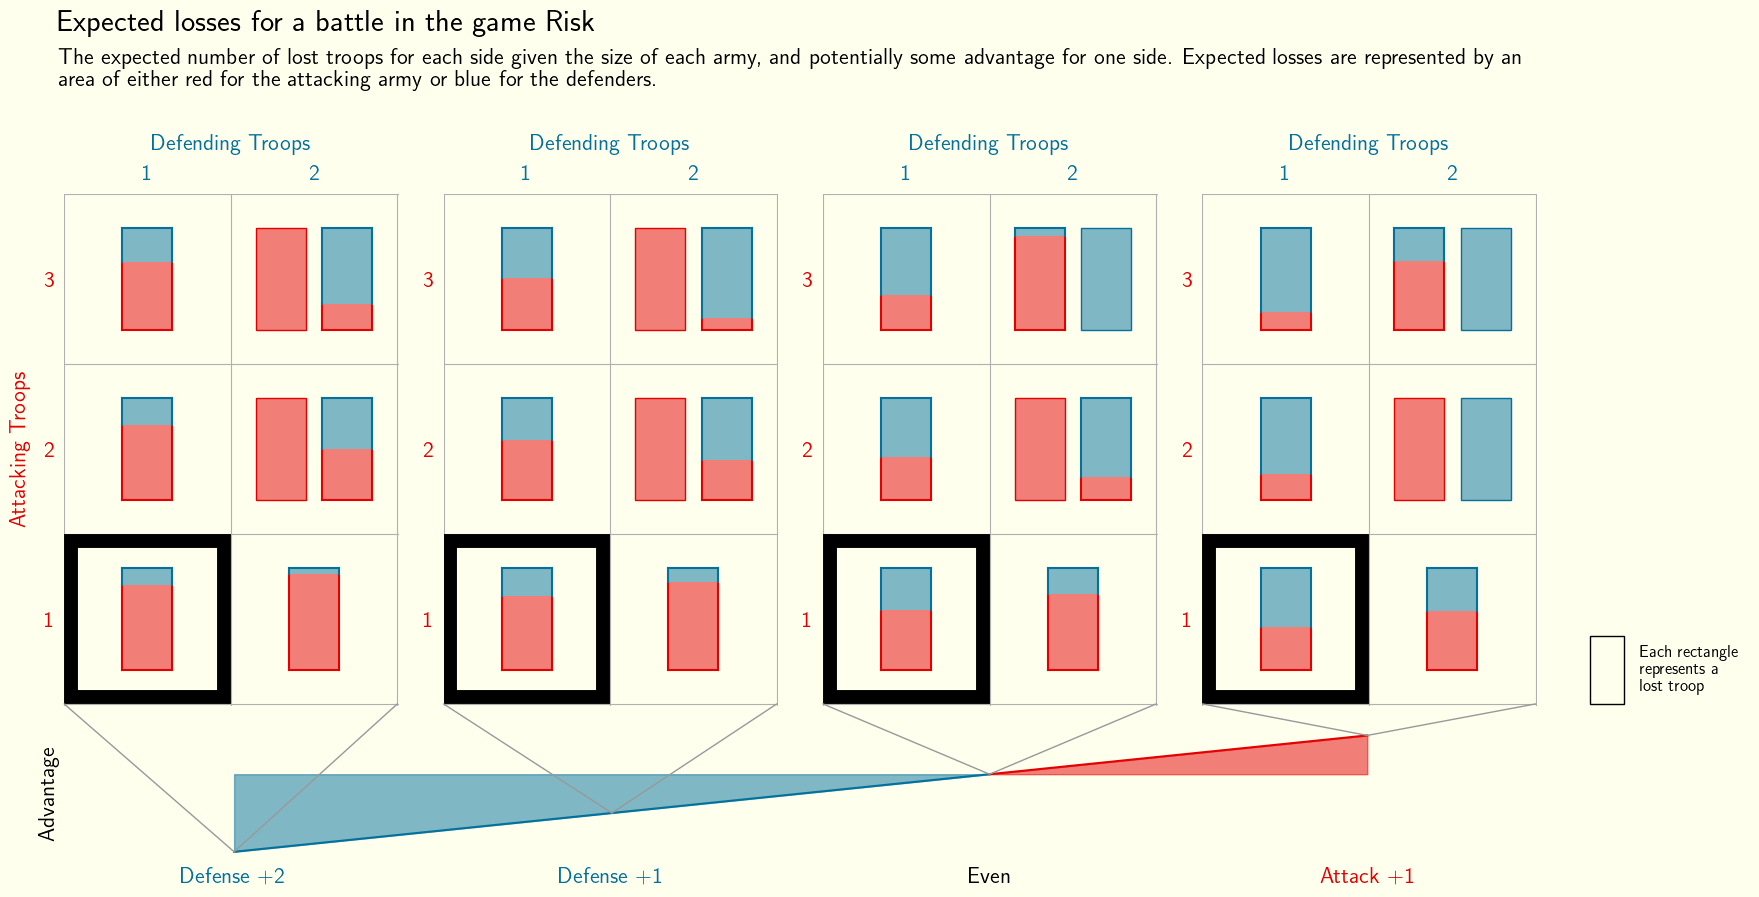
The infographic below represents this 5 dimensional dataset. Each of the 3x2 grids represents a subset of the possible scenarios for a given value of the advantage (shown at the bottom). Within each box of the grid there are rectangles representing all of the troops that will be lost in that battle, coloured according to the number of expected losses for each side.
Dissecting the Visualisation
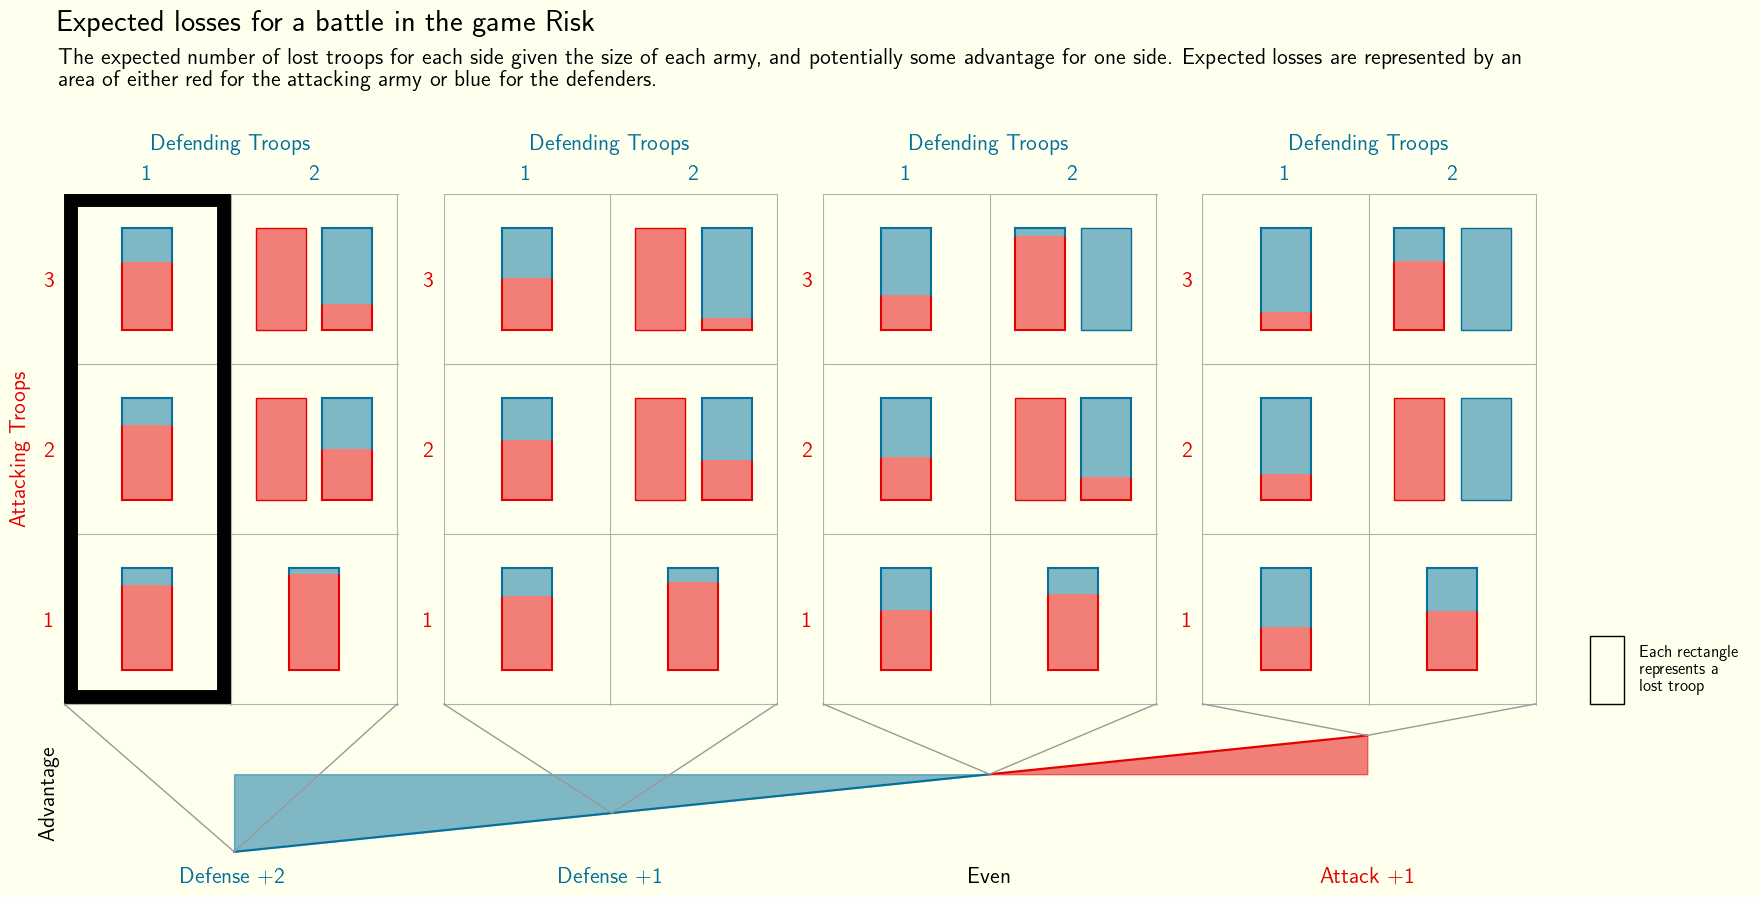
As already mentioned, this infographic contains multiple dimensions of data and as a result can be interpreted in many different ways. For example, looking at one of the columns of the grids can aid with an attacking players battle plan, where they know the size of the defending army and the value of the advantage. Highlighted below is one of the columns, which shows the expected attacking loss for a single defending troop with a +2 advantage. It is clear that this scenario will likely not benefit the attacker as they stand to lose more troops than the defender regardless of how many they take into the battle, although if they have troops to spare they may still want to engage to weaken their opponent as well as themselves.
Equally, the defending player can use the rows of the grids to plan their strategy. The row highlighted below informs the defender that bringing an extra troop in this scenario would take them from likely losing by a large margin to being even in the battle. Also note that by bringing in a second troop, the number of lost troops will now be two as well, so the defender has increased their own expected loss by bringing in the extra troop, although they have increase the attacking losses by more. They could then factor this information into their decision along with knowledge of their available resources etc.

By looking at the same cell in each of the four grids, the visualisation makes it clear what the effect of the advantage is. The highlighted cells below show how the battle changes favour as the advantage goes from defense to attack. This could be used to determine which terretories in the game to attack at which times and also allows for a better understanding of the benefit of an advantage in the game.
Final Word
In summary, this post has explored how battles work in Risk and shown how win probabilities can be calculated in the game. It has also explored the best way to visualise this data and has shown that sometimes custom visualisations can extract additional insights from a problem. This infographic demonstrates that it isn't enough to just look good - it is important to ask the right questions of the data before answering them visually.